Core Web Vitals: what to fix first when LCP, INP, or CLS fails

Direct answer
If a page loses impressions, gets weak CTR, or remains out of the index, do not start with a generic performance checklist.
Start by separating four different diagnoses:
- Is the URL actually indexed and canonicalized as intended?
- Does field data show a real Core Web Vitals problem, or are you reacting to one lab run?
- Which metric is failing: LCP, INP, or CLS?
- Is the real issue speed, or is it search intent, rendering, or snippet mismatch?
Google’s current guidance for Core Web Vitals and page experience still treats CWV as a page-experience signal, not a standalone ranking diagnosis.
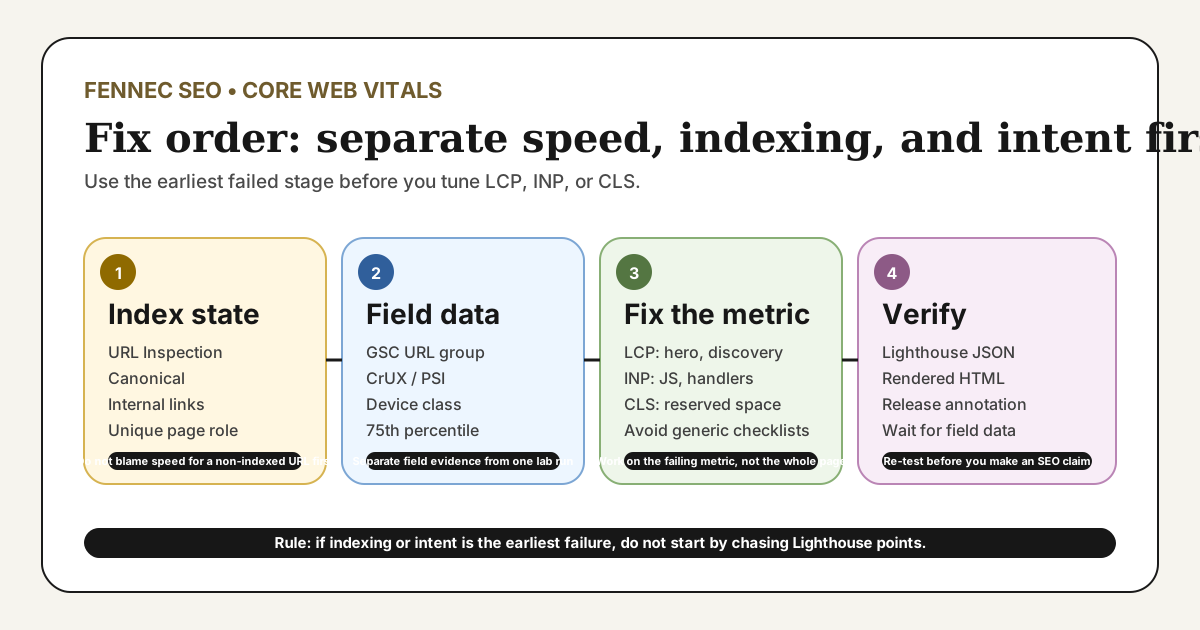
Fix order: speed, indexing, or intent?
Use the earliest failed stage, not the loudest symptom:
| Symptom | Check first | Why this comes before a CWV fix |
|---|---|---|
URL Inspection says Crawled - currently not indexed | Canonical, internal links, uniqueness, and page role | Core Web Vitals alone does not explain why Google chose not to index a URL |
| Search Console Core Web Vitals report shows a poor URL group | Field data, device class, and representative URL | The report reflects grouped field data, not one immediate page trace |
| The page is indexed and near page one, but CTR is weak | Title, opening answer, and snippet pull-through | Click problems are often intent or summary problems before they are speed problems |
| Field and lab data both show poor LCP | Hero asset discovery, blocking CSS or JS, and server path | This is when a performance fix should move to the front of the queue |
If the page is not indexed, fix indexability and distinct value first. If the page is indexed but slow, fix the failing metric directly. If the page is visible but ignored, work on snippet fit before chasing Lighthouse points.
The current metrics and thresholds
The current three metrics are:
- Largest Contentful Paint (LCP) for loading performance. See web.dev’s LCP guide.
- Interaction to Next Paint (INP) for responsiveness. See web.dev’s INP guide.
- Cumulative Layout Shift (CLS) for visual stability. See web.dev’s CLS guide.
Google recommends evaluating the 75th percentile of visits:
| Metric | Good | Needs improvement | Poor |
|---|---|---|---|
| LCP | <= 2.5 s | > 2.5 s and <= 4.0 s | > 4.0 s |
| INP | <= 200 ms | > 200 ms and <= 500 ms | > 500 ms |
| CLS | <= 0.1 | > 0.1 and <= 0.25 | > 0.25 |
One current boundary still worth repeating: INP replaced FID in the Core Web Vitals set. If your checklist still treats FID as current, that checklist is outdated.
Field data, lab data, and index state are different evidence
Teams often mix four different signals into one vague sentence like “the page is bad for Core Web Vitals.”
| Evidence source | What it can tell you | What it cannot tell you |
|---|---|---|
| Search Console Core Web Vitals report | Whether real users in a URL group and device class are seeing poor field performance | The exact code or asset that caused the failure today |
| CrUX or PageSpeed Insights field data | Whether real visits experience a repeated loading, interaction, or layout problem | Which template line to edit first |
| Lighthouse lab runs | How to reproduce a likely bottleneck and inspect the current LCP or blocking work | Your 28-day field status or ranking cause |
| URL Inspection | Whether Google indexed the intended canonical and how the last crawl went | Whether the page passes Core Web Vitals in field data |
This distinction matters because SEO teams often waste time optimizing CWV for URLs that are really blocked by indexing, duplication, rendering, or intent problems.
A real production sample from August 11, 2026
On August 11, 2026, I ran Lighthouse against https://fennecseo.app/blog/core-web-vitals-2026/ with:
URL='https://fennecseo.app/blog/core-web-vitals-2026/'
npx --yes lighthouse "$URL" \
  --only-categories=performance \
  --output=json \
  --output-path=./lighthouse.json \
  --quiet \
  --chrome-flags="--headless=new --no-sandbox"
The current sample output was:
URL: https://fennecseo.app/blog/core-web-vitals-2026/
Fetch time: 2026-08-11T02:06:24.756Z
Performance score: 31
FCP: 5.5 s
LCP: 8.3 s
Speed Index: 8.9 s
TBT: 1,750 ms
CLS: 0
The same run identified the above-the-fold hero image as the current LCP element, and it also surfaced unused third-party JavaScript plus unused icon CSS as follow-up work.
That sample is useful for two reasons:
- it shows a real LCP problem on a live production URL instead of a generic checklist;
- it still does not prove that rankings or indexing changed because of speed alone.
At the same time, Search Console URL Inspection for this English URL currently reports Crawled - currently not indexed, with indexing allowed and the Google canonical matching the declared canonical. That is exactly why CWV, indexing, and page-role diagnosis should be kept separate.
What to fix first by metric
If LCP is failing
Find the actual LCP element first. Then check:
- slow server response or redirect delay;
- late discovery of the hero image or main text block;
- render-blocking CSS or JavaScript;
- above-the-fold images loaded from a heavy remote source;
- client-side rendering that delays the main content.
The fastest wins are often HTML caching, reducing redirects, replacing decorative remote hero images with lighter local assets, preloading the real LCP resource, and cutting blocking work before the main content renders.
If INP is failing
Treat INP as an interaction problem, not a page-load-only problem.
Check for:
- long main-thread tasks after the page becomes visible;
- oversized JavaScript bundles;
- expensive click, input, or filter handlers;
- third-party scripts that delay interaction;
- large rerenders after one user action.
If field INP is poor but the load metrics look acceptable, the bottleneck is often interaction code rather than raw loading.
If CLS is failing
Look for the moving element, not just the final score.
Common causes include:
- images or embeds with no reserved dimensions;
- banners or notifications injected above existing content;
- fonts swapping late and moving headings;
- client-side components that expand after initial paint.
CLS work is usually layout discipline, not a generic “make it faster” project.
When it is not really a Core Web Vitals problem
Do not use CWV as a catch-all explanation.
Sometimes the real issue is:
- the title and opening answer do not match the query;
- important content appears only after JavaScript rendering;
- canonical, hreflang, or indexing controls are wrong;
- the page loads, but the main task is still hard to complete.
If the content appears only after client-side rendering, check Googlebot WRS and JavaScript SEO. If the URL is not indexed, use the Google indexing troubleshooting workflow before you request more performance work. If the page is indexed but weak for its query, use the SEO Audit tool to separate user-task fit from page speed.
What Core Web Vitals can and cannot say about SEO
Google’s page experience guidance says ranking systems use page-experience signals and reward pages that provide a good experience. The same guidance also makes clear that useful content can still perform well even if page experience is not perfect.
That means:
- better CWV can reduce friction for real users;
- poor CWV is a valid diagnosis target;
- good CWV does not guarantee higher rankings;
- bad CWV does not prove that relevance, content quality, or rendering are fine.
This is why “we improved Lighthouse from 31 to 80, so rankings should rise” is not a reliable SEO conclusion.
A reproducible verification workflow
- Check URL Inspection first so you know whether the page is indexed, allowed, and canonicalized as intended.
- Open PageSpeed Insights for the representative URL and separate field data from lab data.
- Run a reproducible Lighthouse test and save the JSON output.
- Identify the real failing metric and the current LCP element or interaction bottleneck.
- Re-test for regressions in layout, rendering, and conversion paths.
- Annotate the release date and wait for enough field data before judging the result.
If you need a quick rendered check before shipping:
URL='https://fennecseo.app/blog/core-web-vitals-2026/'
curl -I -L "$URL"
curl -sL "$URL" | rg -n 'canonical|hreflang|img|preload|fetchpriority'
That does not replace field data, but it helps you catch obvious deployment mistakes before the 28-day window catches up.
Common mistakes
- Treating one Lighthouse run as proof of a field-data problem.
- Blaming Core Web Vitals for a URL that is not indexed.
- Optimizing TBT and claiming INP is fixed without checking field evidence.
- Improving lab speed while leaving the actual LCP element unchanged.
- Keeping a decorative remote hero image above the fold and calling it a content asset.
- Improving speed while the title and opening answer still miss the query.
What to do next
- Use the Core Web Vitals checker for a quick page-level test.
- Read the tighter definition page at Core Web Vitals Wiki.
- If the issue may be broader than speed, run the SEO Audit tool.
- If the problem looks like indexing rather than performance, continue with Google indexing troubleshooting.
Q&A
What are the current Core Web Vitals thresholds?
At the 75th percentile of visits, aim for LCP at or below 2.5 seconds, INP at or below 200 milliseconds, and CLS at or below 0.1.
What should I check before blaming Core Web Vitals?
Check whether the URL is indexed, whether field data actually shows a CWV problem, and whether the page has an intent or snippet problem before you jump into a speed-only fix.
Do better Core Web Vitals guarantee better Google rankings?
No. Google uses page experience signals, but relevance and helpful content still matter more than a good CWV score alone.